
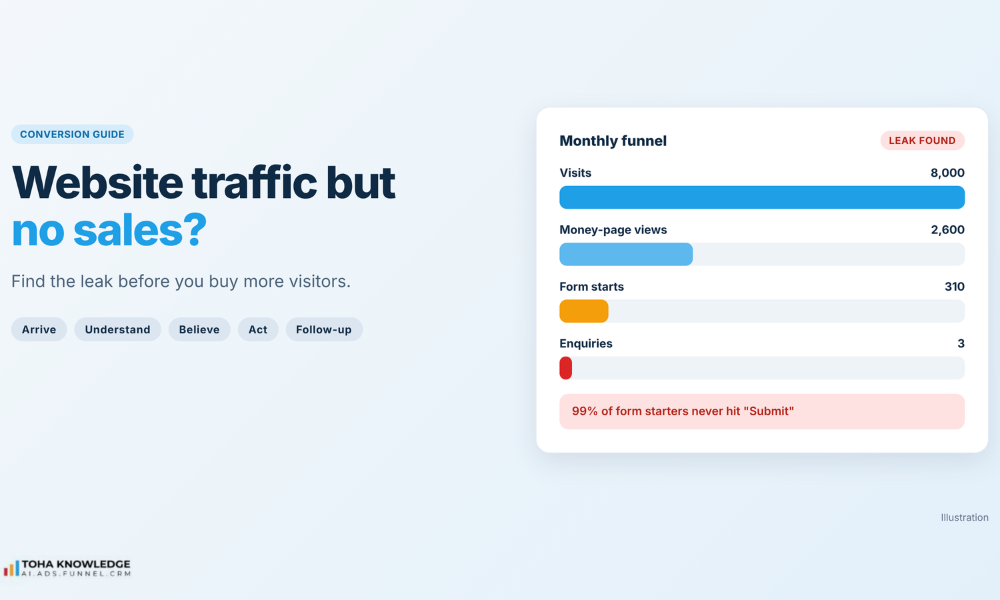
Last month a client showed us their dashboard: 8,000 visits a month and 3 enquiries. They wanted more SEO. We spent one afternoon in their analytics and found the real problem in their contact form.
If your website gets traffic but no sales, buying more visitors is usually the wrong next step. Traffic is not the problem. Something between “arrived” and “paid” is leaking, and more traffic only sends more people through the same leak.
This guide does not start with theory. It starts with a 3-question test that tells you whether you have a traffic problem or a leak. Then it walks through the five places visitors leave, how to spot each one in your data and what to fix first.
Key Takeaways
- Traffic is not the same as sales. Visits only count arrivals. What pays the bills is how many of those visitors call, book, buy or send a form.
- Test before you spend. A 3-question leak test in Google Analytics 4 tells you in about 15 minutes whether you need more traffic or have a leak (once your key events are set up).
- Visitors leak at five stages: arrive, understand, believe, act and follow-up. Each stage has its own warning sign in your data and its own fix.
- Follow-up is the leak most guides miss. For service businesses, a lead who waits hours for a reply often books someone else. An instant automatic reply closes that gap.
- Fix the stage closest to the money first. Start on the pages that already get the most visits, and change one thing at a time.
- Small fixes add up. Moving from 1% to 1.2% conversion on the same traffic adds 20% more sales without spending more on ads.
- Measure money, not just conversion rate. Track revenue per visitor and lead quality, so a “win” isn’t hiding a loss.
- Free tools are enough to start: Google Analytics 4, Microsoft Clarity and PageSpeed Insights.
Step 1: Take the 3-question leak test
Before you change your site or your budget, answer three questions. You need Google Analytics 4 and about 15 minutes. Look only at your money pages: service, product, pricing and contact.
Before you start: this test only works if GA4 already tracks your key events (calls, bookings, form submits, purchases). If it doesn’t, set those up first (Week 1 of the plan below) and collect at least 2–4 weeks of data before you judge anything. If you sell something with a long buying cycle, such as B2B services or big renovations, use a longer window.
| Question | Where to look in GA4 | If yes |
| 1. Do your money pages get so few visits that you only see a handful of conversions a month? | Reports → Engagement → Pages and screens | You may really need more traffic. Fix the leaks you find anyway, then grow traffic. |
| 2. Do people reach those pages but rarely call, book, buy or send a form? | Reports → Engagement → Events (your key events) | You have a leak: high traffic, low conversions. Keep reading before you spend more. |
| 3. Is one traffic source or device much worse than the others? | Add a comparison by “Session default channel group” and “Device category” | That is where your leak is. A site-wide average hides it. |
There is no magic visitor number for question 1. A local plumber can learn a lot from 300 visits a month, while an online store may need thousands. The real test is whether you have enough conversions to compare one month, source or device against another.
Most businesses that say “we need more traffic” answer yes to question 2. If that is you, the rest of this guide is your plan.
Not sure how to read your numbers? Book a free 20-minute leak check and we’ll go through your analytics with you.
Step 2: Why your website gets traffic but no sales: the 5 leaking stages
When website visitors are not converting, it is rarely one big problem. Every visitor passes five stages on the way to becoming a customer. Each stage has its own warning sign in your data and its own fix. Find the first stage where the numbers fall off, and start there.
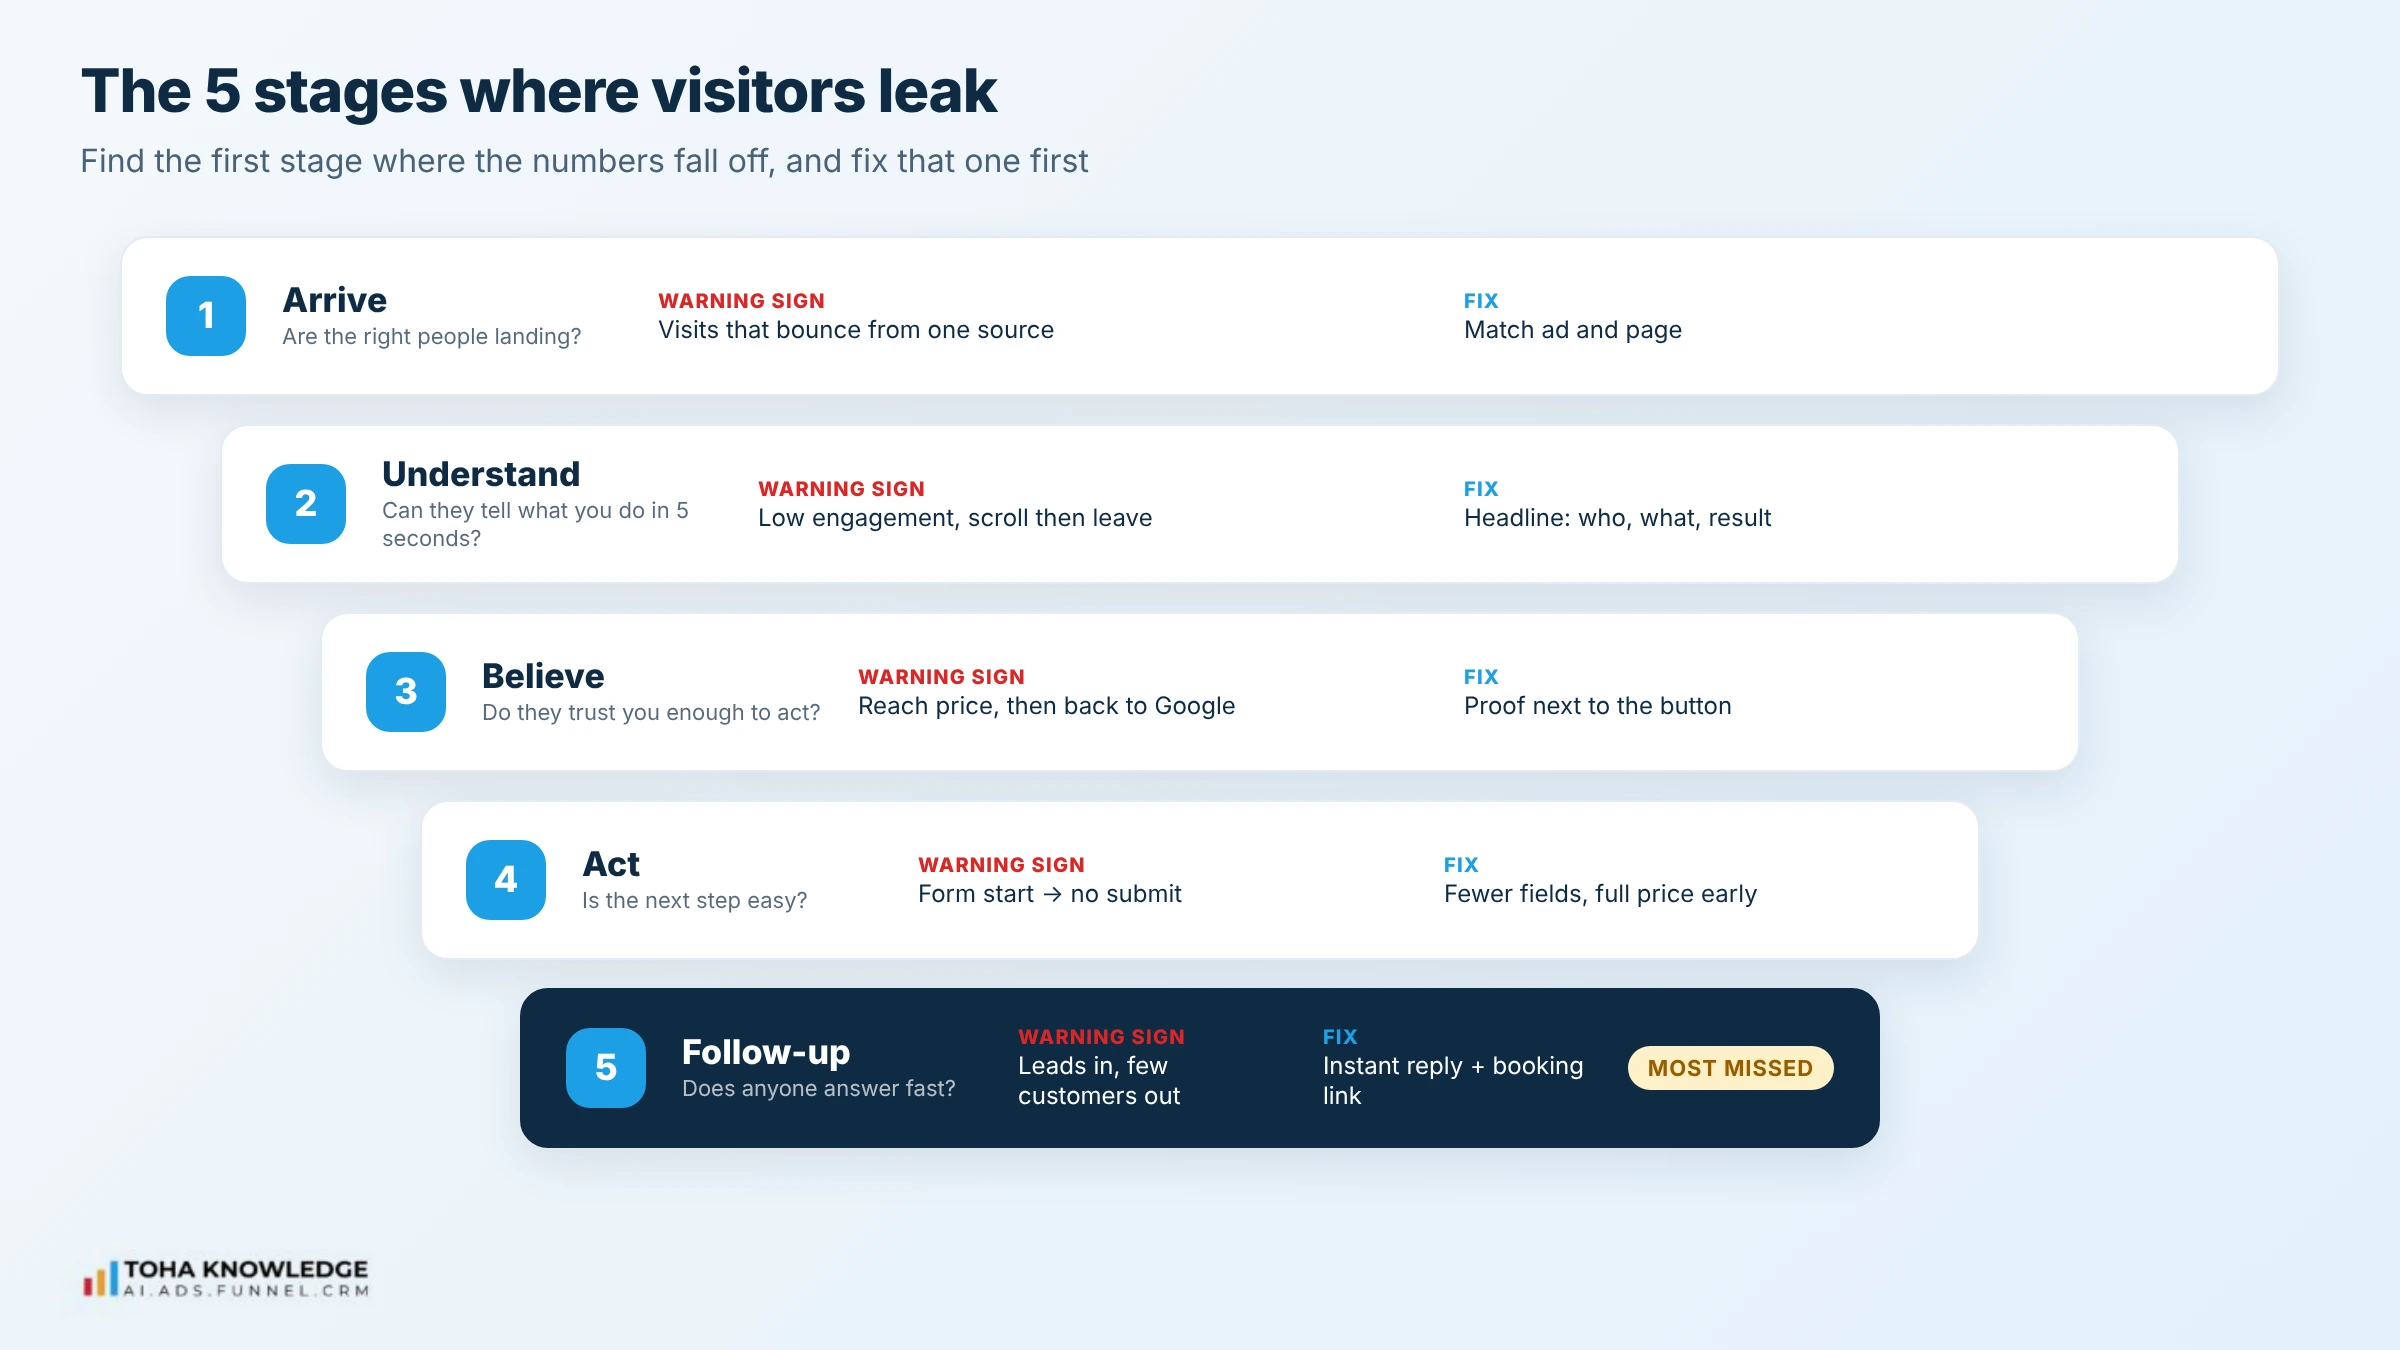
The examples below are illustrations of common patterns, not client data.
Stage 1: Arrive. Are the right people landing?
Warning sign: one source (often paid ads or a broad blog post) brings lots of visits that leave fast and never convert.
Why it leaks: the ad or search result promises one thing and the page delivers another. Or the keyword attracts people who were never going to buy.
Fix: match each ad and landing page word for word. Point buying-intent keywords to service pages, not blog posts. A [website SEO audit](LINK: SEO audit page) will show which keywords bring buyers and which bring browsers.
Example: A roofing company runs Google Ads on “roof repair”. The ad says “Same-week repairs”, but it sends people to the homepage, which talks about new roof installs. Visitors who wanted a quick repair can’t find it and leave. Pointing the ad to a repair page that repeats “same-week repairs” in the headline closes the gap.
Stage 2: Understand. Can they tell what you do in 5 seconds?
Warning sign: low engagement time on your key pages, and Microsoft Clarity recordings that show people scrolling, then leaving.
Why it leaks: the headline is about you, not them. “Quality solutions since 2005” says nothing.
Fix: rewrite the top of the page to say what you do, who it is for and the result. “Websites for dental clinics that bring in new patients” beats “We build websites”.
Example: An accounting firm’s homepage opens with “Excellence in every number”. A café owner looking for bookkeeping help can’t tell if the firm works with small businesses. Changing the headline to “Monthly bookkeeping for restaurants and cafés, from $199” tells the right visitor in one line that they are in the right place.
Stage 3: Believe. Do they trust you enough to act?
Warning sign: people scroll to your price or contact section, pause, then go back to Google.
Why it leaks: most visitors are not against you. They are just not convinced yet. An NP Digital survey of 100 businesses found that companies overestimate how much trust their websites create, and that many visitors feel neutral rather than trusting. Treat that as a hint, since the survey does not share its visitor sample size.
Fix: put proof right next to the button: a short review, a star rating, a client logo or a clear guarantee. A real photo of your team beats a stock photo.
Example: A home cleaning service has 120 five-star Google reviews, but none of them appear on its booking page. Visitors reach the price, hesitate, and leave to check reviews elsewhere, where they also find competitors. Adding three short reviews and the star rating right above the “Book now” button keeps them on the page.
Stage 4: Act. Is taking the next step easy?
Warning sign: people start a form or checkout and stop halfway. GA4 shows a big drop between “form start” and “form submit”.
Why it leaks: too many fields, surprise costs, forced sign-ups or a slow page. For online stores, Baymard Institute puts the average cart abandonment rate at about 70%, based on 50 studies. Leaving aside people who were just browsing, the top reason shoppers give is extra costs (shipping, tax or fees) that were too high, cited by about 4 in 10.
Fix: show the full price early, allow guest checkout, cut every form field you don’t need, and test your pages with PageSpeed Insights. Slow pages are one of the most common website conversion problems we see, and a [faster, better-built website](LINK: web development page) fixes them at the root.
Example: A dental clinic’s appointment form asks for 11 details, including insurance number and date of birth, before showing available times. GA4 shows many people starting the form and few finishing. Cutting it to name, phone and preferred time, and collecting the rest at the first visit, removes the main reason people quit.
Stage 5: Follow-up. Does anyone answer fast?
This is the leak most CRO guides skip, and for service businesses it is often the biggest one.
Warning sign: form leads look healthy, but few become paying customers. Your team replies hours or days later.
Why it leaks: a person who fills in your form is often filling in your competitors’ forms too. The first business to reply usually gets the conversation. A Harvard Business Review study that audited 2,241 US companies found that firms contacting a lead within an hour were nearly 7 times as likely to qualify it as firms that waited even an hour longer. The same study found 23% of companies never replied at all.
Fix: send an automatic reply within a minute (text and email), offer a booking link right away, and alert your team the moment a lead comes in. This is exactly what lead follow-up automation is built for.
Example: A plumbing company gets 40 form leads a month. The office checks the inbox twice a day, so most people wait several hours for a reply. By then many have booked another plumber. An instant text plus a phone alert to the team means every lead hears back in under a minute.
Why fixing a leak beats buying more traffic
Revenue comes from a few numbers multiplied together. The formula depends on how you sell.
Online stores: Visitors × Conversion rate × Average order value
Service businesses: Visitors × Lead conversion rate × Lead-to-customer rate × Average customer value
Example 1: an online store
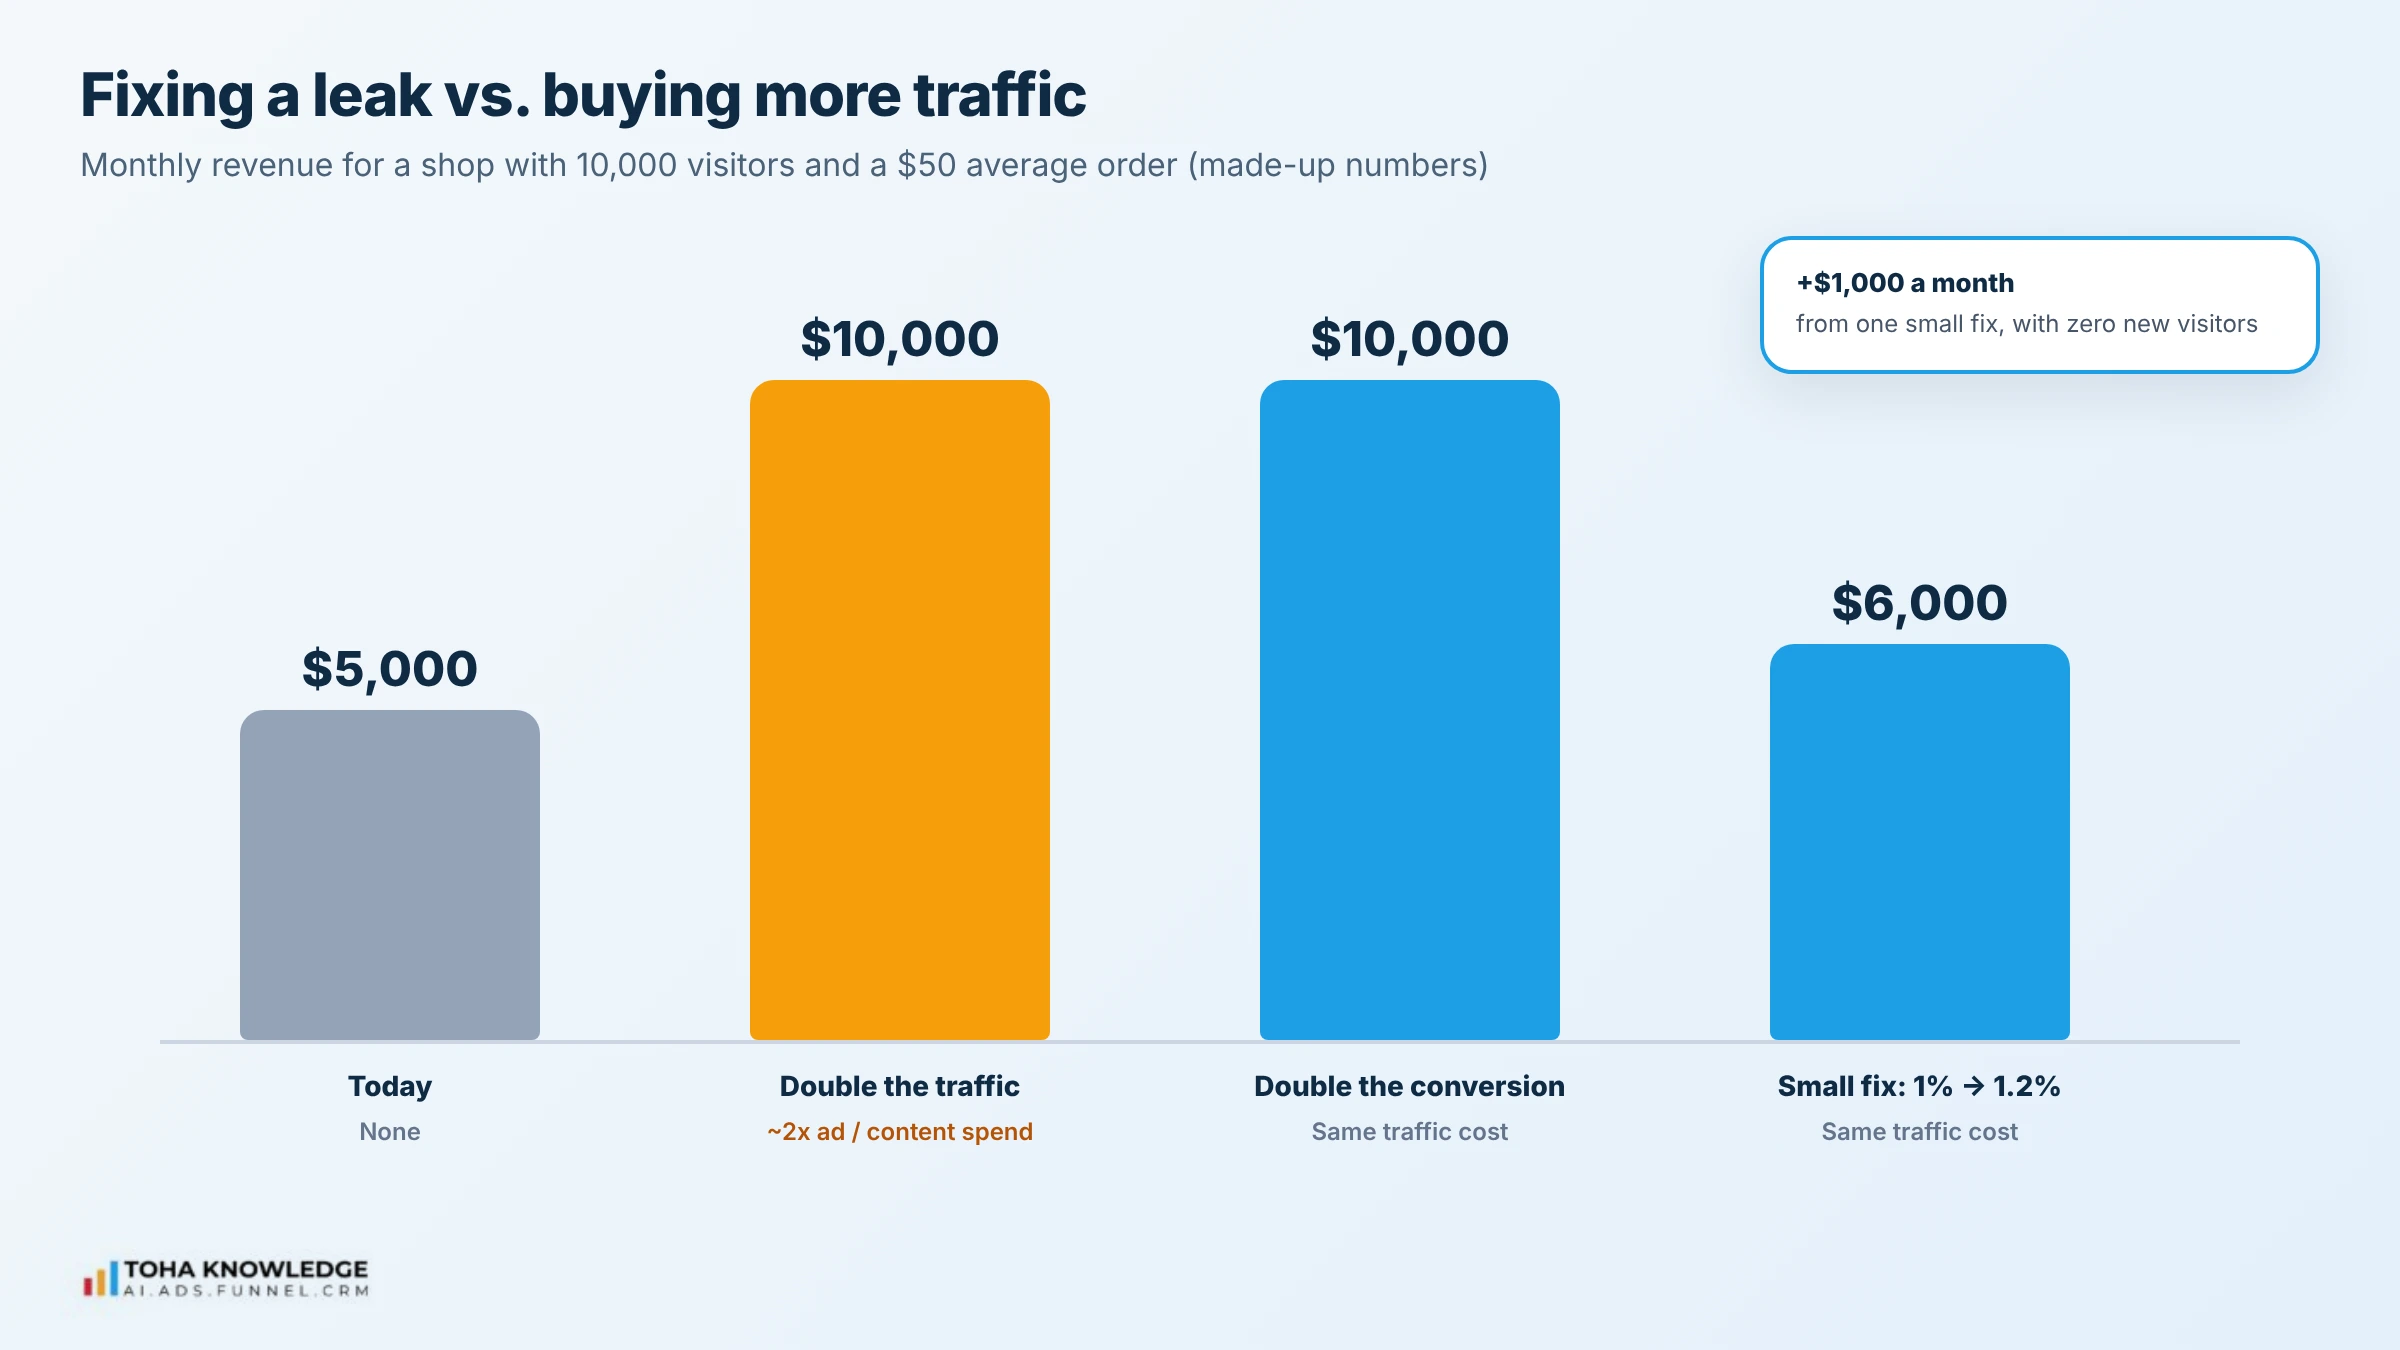
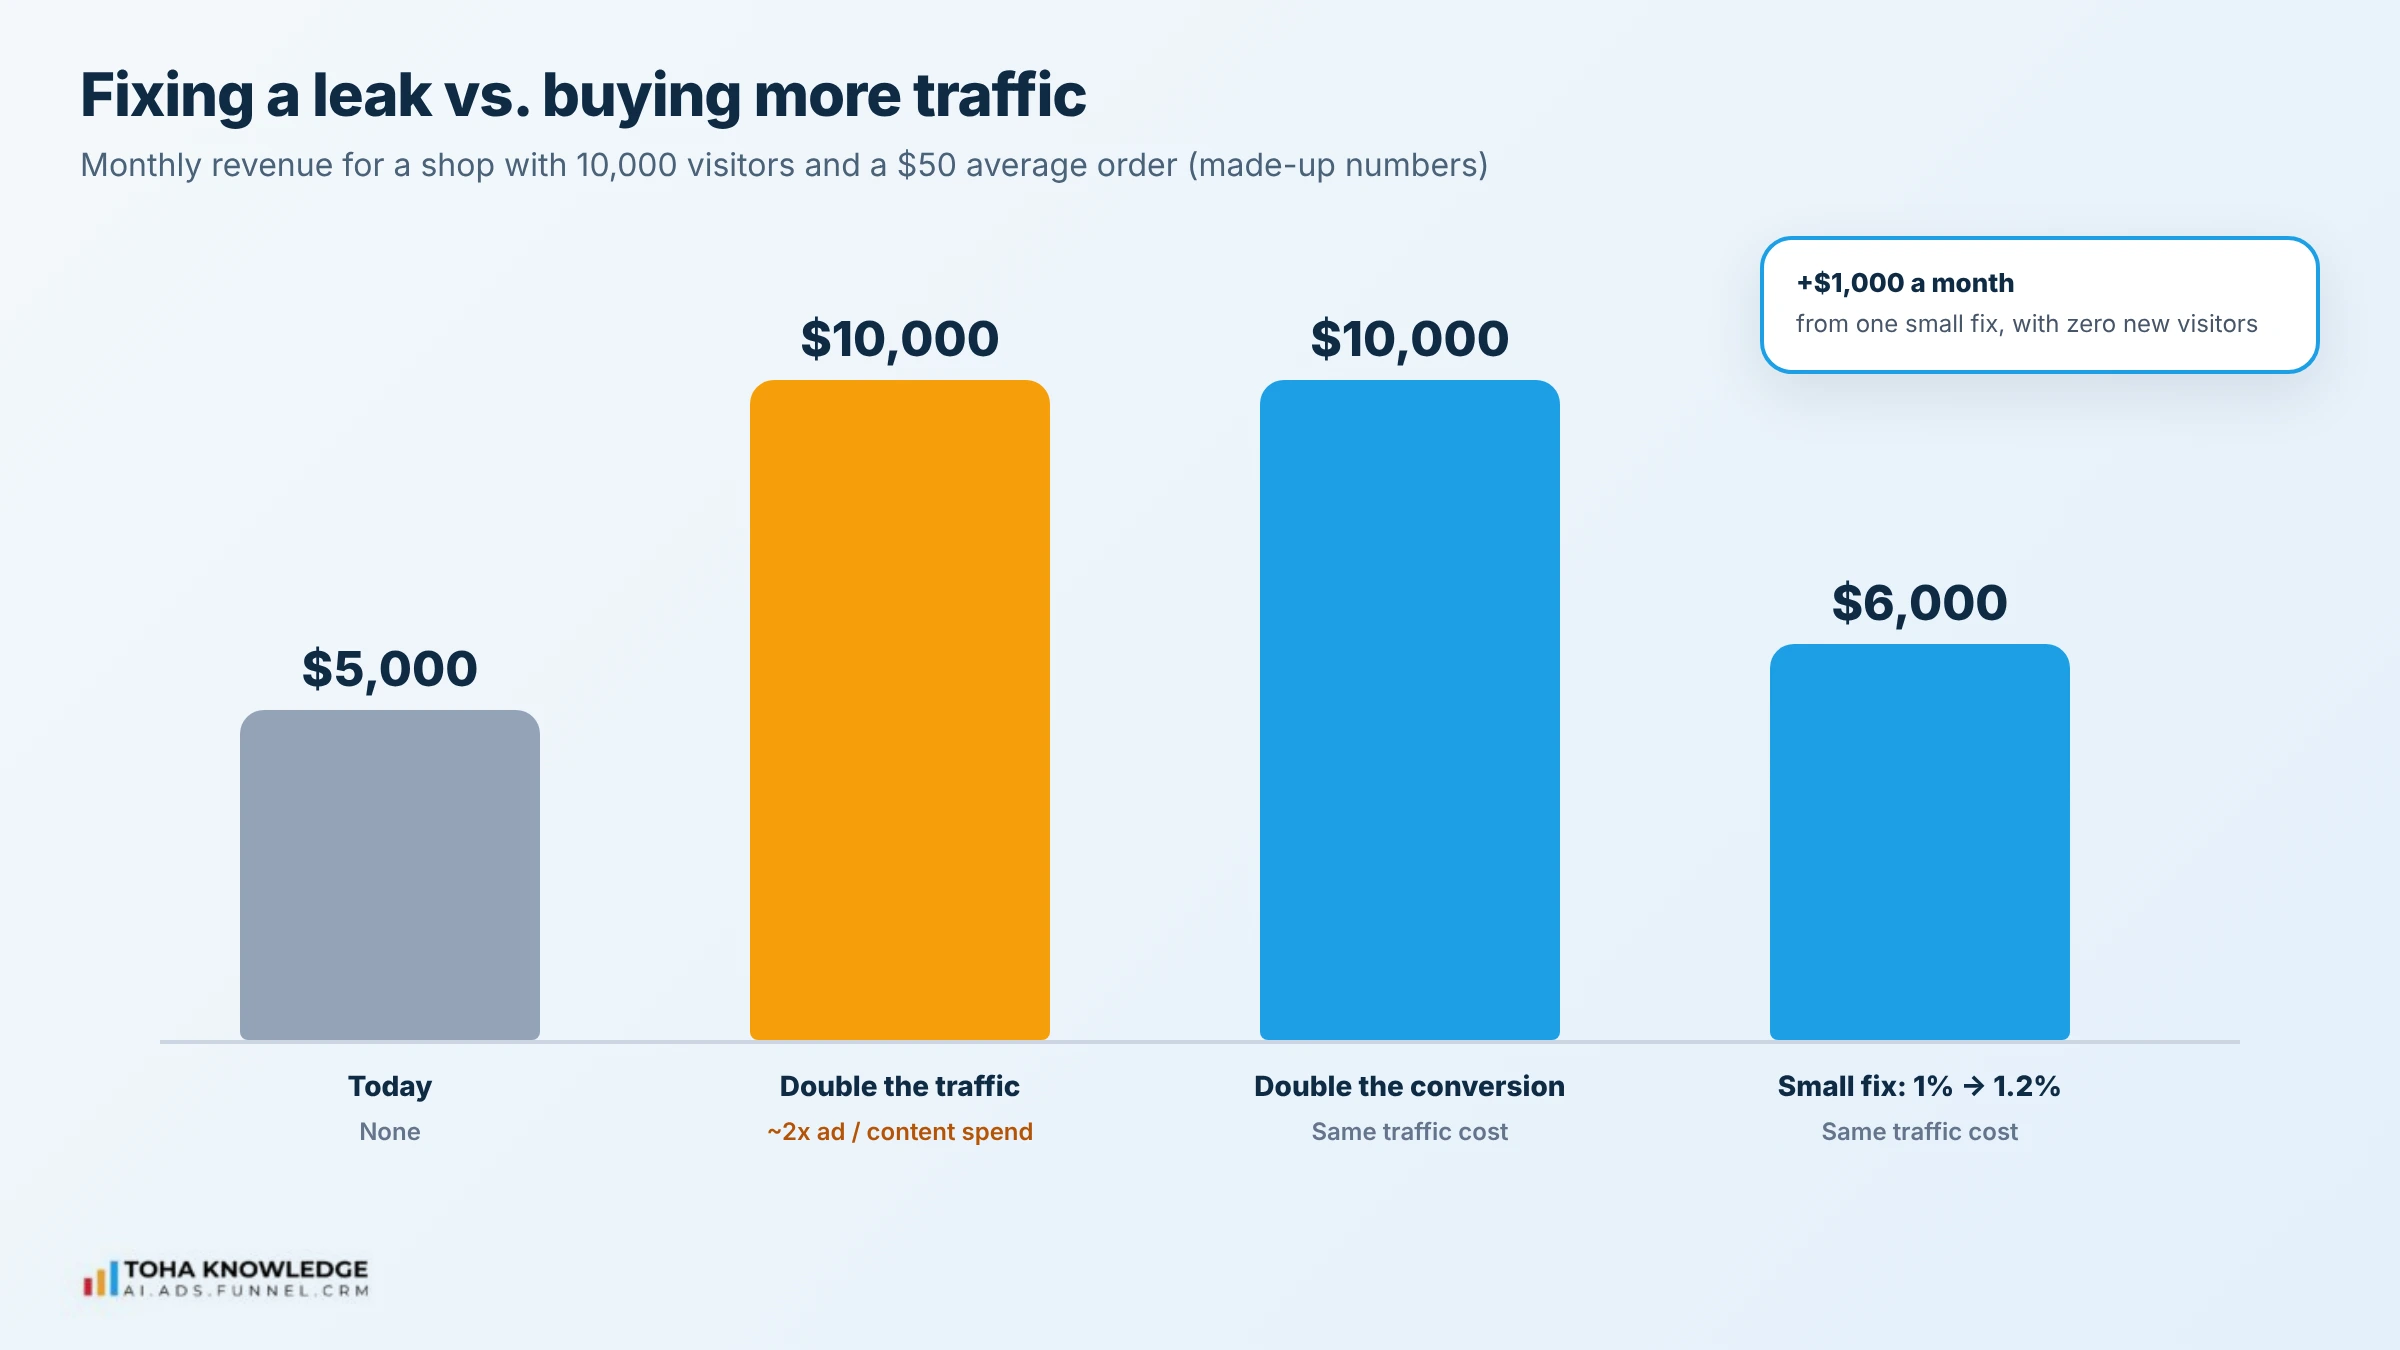
A shop gets 10,000 visitors a month, 1% buy and the average order is $50. That is 100 sales and $5,000. These are made-up numbers, not real data.
| Option | Visitors | Conversion | Sales | Revenue | Extra cost |
| Today | 10,000 | 1% | 100 | $5,000 | None |
| Double the traffic | 20,000 | 1% | 200 | $10,000 | Roughly double the ad or content spend |
| Double the conversion | 10,000 | 2% | 200 | $10,000 | Traffic cost stays the same |
| Small fix | 10,000 | 1.2% | 120 | $6,000 | Traffic cost stays the same |
The last row matters most. You don’t need to double anything. A small fix to one leak adds $1,000 a month with no new visitors, and it keeps paying on every channel that sends you traffic.
Example 2: a service business
A home services company gets 2,000 visitors a month. 3% send a form or call (60 leads), 25% of those leads become customers (15 jobs), and the average job is worth $1,200. That is $18,000 a month. Again, these are made-up numbers.
Now the company sets up an instant reply, and the lead-to-customer rate goes from 25% to 30%. Same visitors, same leads: 18 jobs and $21,600. That is $3,600 more a month, and it came from Stage 5, a leak that never shows up in your traffic reports.
Most teams still put their effort into traffic. In an NP Digital survey of 100 businesses with $10M+ revenue, teams said 93% of their effort went to traffic, even though they credited conversion rate with 68% of their revenue impact. It’s a self-reported survey by an agency that sells conversion work, so read it as a direction, not proof.
Step 3: How to improve website conversions: fix in the right order
Start at the leaking stage closest to the money, on the pages that already get the most visits. A fix on a busy page pays off faster than a perfect fix on a page nobody sees.
- Follow-up and Act first. These people already raised their hands. Losing them is the most expensive leak.
- Believe next. Proof near the button is quick to add and helps every visitor.
- Understand third. A headline rewrite takes an hour but needs testing.
- Arrive last. Changing keywords and ads takes longer to show results.
Score your ideas before you start
Your leak test will give you more ideas than you have time for. Write each one down and score it from 1 to 5 on three questions, then add the scores up. Start with the highest total.
| Question | 1 means | 5 means |
| Impact: how much could this move sales? | A small page few people see | A money page with lots of traffic |
| Ease: how fast can we do it? | Weeks of design and development | Under an hour, no developer |
| Confidence: how sure are we it will work? | A hunch | The data or customer feedback points straight at it |
An idea that scores 13 or more is usually worth doing this week. Anything under 8 can wait for the next round.
Change one thing at a time so you know what worked. If your site gets few visits, test big changes, such as a new headline or offer, because small tweaks take months to show a clear result.
What to test at each stage
Not sure what to change first? Pick one idea from the stage that is leaking.
| Stage | Test ideas |
| Arrive | Send each ad to its own matching page · Repeat the ad’s main promise in the page headline · Move buying-intent keywords from blog posts to service pages |
| Understand | Headline that names the customer and the result · Add a price range or “starting from” price · Replace a slider with one clear image and one message |
| Believe | Reviews next to the main button · A short video of the owner or team · A clear guarantee or refund promise · Client logos or a short case study |
| Act | Fewer form fields · Guest checkout · One main button instead of three · Show available times instead of “we’ll call you” |
| Follow-up | Instant text and email reply · Booking link in the first reply · Team alert on every new lead · A second follow-up if there is no reply after 24 hours |
Keep a simple log of each test: what you changed, the date, and what happened. After a few rounds, that log becomes your own playbook of what works for your customers.
Your 30-day leak-fixing plan
Week 1: Find the leak
- Set up key events in GA4 for calls, bookings, forms and purchases
- Install Microsoft Clarity on your money pages
- Run the 3-question leak test (if your events are new, collect data for 2–4 weeks first)
- Note which of the 5 stages leaks first
Week 2: Fix the follow-up and the form
- Set up an instant auto-reply for every new lead
- Cut your main form to the fields you really need
- Fix any mobile speed problems PageSpeed Insights flags
Week 3: Add proof and clarity
- Add a review, rating or guarantee next to your main button
- Rewrite the headline of your busiest money page
- Start one test, or a before-and-after comparison on a quiet page
Week 4: Measure and repeat
- Compare revenue per visitor and lead quality with Week 1
- Roll the winning change out to similar pages
- Run the leak test again and pick the next stage
Step 4: Check the fix actually made money
A higher conversion rate is not always a win. A discount pop-up can lift conversions while shrinking your average order. A shorter form can double leads while filling your calendar with poor fits. Track these four numbers next to conversion rate:
| Metric | How to work it out | What it tells you |
| Revenue per visitor | Revenue ÷ visitors | Whether each visit is worth more |
| Cost per customer | Marketing spend ÷ new customers | Whether growth is getting cheaper |
| Lead-to-customer rate | Customers ÷ leads | Whether you are getting the right leads |
| Customer lifetime value | Average spend per customer over time | Whether new customers stay |
When more traffic is the right answer
Fixing leaks first does not mean traffic is bad. Grow traffic with [SEO services](LINK: SEO service page) or ads when:
- Your money pages already convert well, but too few people see them
- Your site is new and has too few visits to learn from
- You are launching a new service or entering a new area
- A busy season is coming and your pages are ready
Mistakes that keep the leak open
- Changing five things at once. You won’t know which change worked.
- Stopping a test after three days. Early leaders often fall back. Give it at least one to two full weeks.
- Looking only at site-wide averages. The leak hides in one source or one device.
- Copying a competitor’s page. Their visitors are not your visitors. Use it as an idea, then test it.
- Replying to leads tomorrow. By then they have booked someone else.
FAQs
Why am I getting website traffic but no sales?
Usually one of five stages is leaking: the wrong people arrive, they don’t understand your offer, they don’t trust you yet, the next step is hard, or nobody follows up fast. The 3-question leak test shows which one.
How do I know if I have a traffic problem or a conversion problem?
If few people reach your money pages, it is a traffic problem. If many reach them and few act, it is a conversion problem. Check by source and device, not only the site total.
What are the most common website conversion problems?
Ads that don’t match their landing page, vague headlines, no proof near the main button, long forms or surprise costs, slow mobile pages, and slow replies to new leads.
What is a good conversion rate?
It depends on your industry, page and traffic source. As a rough guide, Unbounce’s analysis of 41,000+ landing pages put the median conversion rate at 6.6% across all industries. Compare against your own past results first, since your best benchmark is last month.
How can I improve website conversions without more traffic?
Fix the stage closest to the money first: reply to leads instantly, shorten your forms, and put reviews or a guarantee next to your main button. Then work back to headlines and ad matching.
Do I need paid tools to find the leak?
No. Google Analytics 4, Microsoft Clarity and PageSpeed Insights are free and enough to find your first leaks.
How fast should I reply to a new lead?
As fast as you can, ideally within minutes. Research in Harvard Business Review found that contacting a lead within an hour made companies nearly 7 times as likely to qualify it. An automatic text or email reply with a booking link covers you when your team is busy.
Conclusion
If your website gets traffic but no sales, more traffic will not fix it. Run the leak test, find the first stage where people drop off, and fix that one stage on your busiest money page. Measure the result in revenue, not just conversion rate, then move on to the next leak. Each fix keeps paying on every visitor you already have.
Want a second pair of eyes? Toha Knowledge helps businesses with SEO, conversion and automation. Book a free leak check and we’ll find your biggest leak together.